S&P 500 Monthly Returns and Percentage of Time Up – Presidential Cycle Year 4

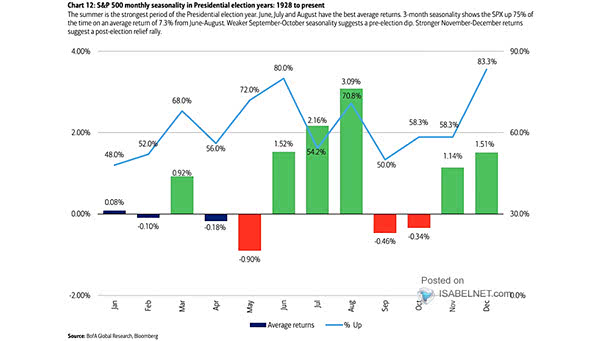
S&P 500 Monthly Returns and Percentage of Time Up – Presidential Cycle Year 4 Seasonality provides valuable insights into stock market trends. Historically, after experiencing weaknesses in September and October during election years, the S&P 500 tends to rebound with strong returns in November and December. Image: BofA Global Research

Median 2-Week S&P 500 Returns

Median 2-Week S&P 500 Returns Seasonality is a useful analytical tool, not a predictor of future market movements. Historical data indicate that the U.S. stock market often experiences weakness in the latter half of September. Is this time different? Image: Goldman Sachs Global Investment Research

Average S&P 500 Returns by the First and Second Half of the Month

Average S&P 500 Returns by the First and Second Half of the Month Seasonality is a useful statistical tool, but not a crystal ball for predicting future market movements. Past patterns indicate that the U.S. stock market has often demonstrated strength in the first half of July. Image: BofA Global Research

S&P 500 Average 10-Day Returns

S&P 500 Average 10-Day Returns Historically, U.S. stocks are entering a seasonally bullish period, associated with positive performance and upward momentum. Image: Carson Investment Research

S&P 500 Average Return for Each Day

S&P 500 Average Return for Each Day This spreadsheet shows the S&P 500 average return for each day from 1950 to 2018. “History never repeats itself but it rhymes” –Mark Twain. October 28 has been historically the best day of the year for the S&P 500. You may also like “S&P 500 vs. Its Seasonal Pattern.” Image: Ryan…