Real S&P 500 Market Doubles
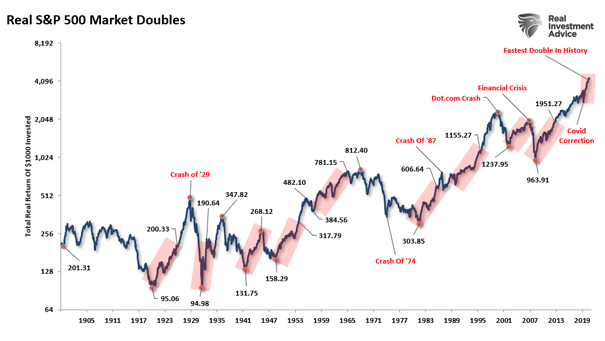
Real S&P 500 Market Doubles Is the U.S. stock market poised for a correction after 100% gain from its March 2020 low? Image: Real Investment Advice
Real S&P 500 Market Doubles Is the U.S. stock market poised for a correction after 100% gain from its March 2020 low? Image: Real Investment Advice
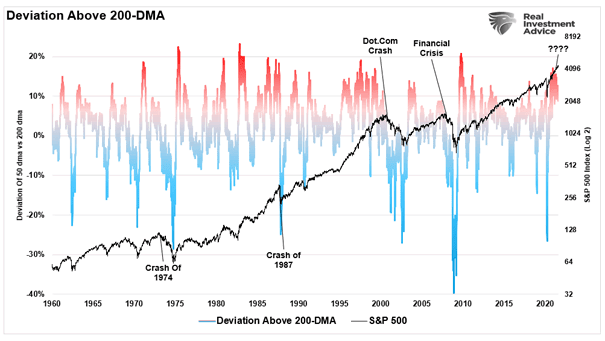
S&P 500 and Deviation Above 200-Day Moving Average The S&P 500 index is currently more than 11% above its 200-day moving average. Is a market correction on the horizon? Image: Real Investment Advice

6-Month S&P 500 Return and 6-Month Change in U.S. 10-Year Yield The risk of a correction in U.S. equities is increasing. Image: Goldman Sachs Global Investment Research
Returns – S&P 500 Four Year Presidential Cycle Is there a risk of a market correction? The S&P 500 is entering what has historically been a period of weakness. Image: BofA Global Research
S&P 500 Uninterrupted Bull Markets Without -10% Swing Down Since 1950, there has been an average of one 10% correction per year for the S&P 500 Index. Image: Nautilus Research
U.S. 10-Year Breakeven Inflation vs. Commodities (Leading Indicator) Is a commodity price correction imminent? Image: Alpine Macro
Bitcoin – Total Cryptocurrency Market Capitalization The crypto collapse could suggest that the correction is not yet over, as it continues to track the 2017/18 market cycle. Image: J.P. Morgan
S&P 500 – Percent Deviation of Price from 75 Week Moving Average Is there a market correction on the horizon? It is highly likely that the gap between the S&P 500 Index and its 75-week moving average will close eventually. Image: Real Investment Advice
Margin Debt as a Percentage of the Market Capitalization of the S&P 500 Downside corrections tend to occur after peaks in margin debt relative to the S&P 500 market capitalization. Image: BofA Global Research
BAA Corporate Yield (Inverted) vs. S&P 500 Can stocks keep rising or should investors expect a market correction? Image: BCA Research