U.S. Budget Deficit

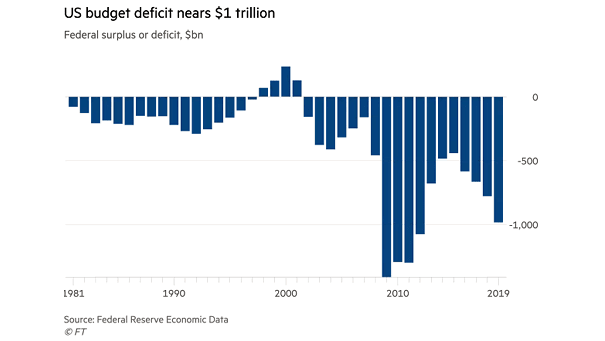
U.S. Budget Deficit Government spending increases despite President Trump’s promise to eliminate debt. Image: Financial Times

U.S. Retail Sales and Food Services vs. Fair Value Model

U.S. Retail Sales and Food Services vs. Fair Value Model After disappointing U.S. retail sales in September, this chart provides a good forward guide for U.S. consumer spending. The Fair Value Model leads consumption and includes: ASA Staffing Index (temps), spread between good unemployment (job leavers) and bad unemployment (job losers), and forward-looking income expectations.…

Consumption Growth and Household Debt

Consumption Growth and Household Debt This chart shows the effects of household debt and suggests that high household debt limits consumer spending. Image: Oxford Economics

Late-cycle Worries

Late-cycle Worries Consumers are currently more optimistic today than about the future. That’s worrying because consumer spending contributes 70% of total U.S. production. Image: Deutsche Bank

How Average Americans Spend their Money?

How Average Americans Spend their Money? The average American household – $53,708 in spending. That’s 73% of total income. Image: Visual Capitalist

How Have Real Personal Consumption Expenditures Declined Ahead Of Every Recession?

How Have Real Personal Consumption Expenditures Declined Ahead Of Every Recession? Consumer spending drives the US economy. Historically, Real Personal Consumption Expenditures, which accounts for about 70% of GDP, decline before a recession. That’s not the case today. So, a recession may not be imminent in this late-cycle expansion.

Visualizing How Americans Spend Their Money

Visualizing How Americans Spend Their Money The Consumer Expenditure Survey is a Bureau of Labor Statistics (BLS) survey that collects information on the buying habits of U.S. consumers. Image: howmuch.net