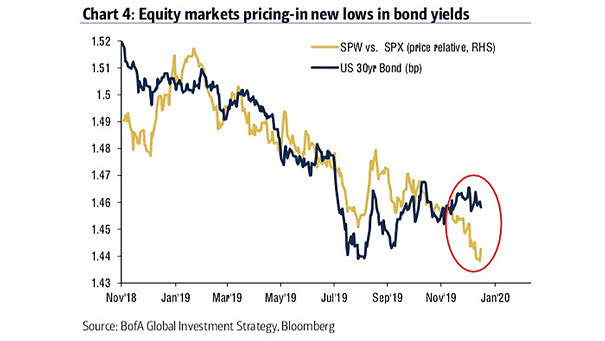
S&P 500 Equal Weight Index vs. S&P 500 (Price Relative) and U.S. 30-Year Bond
S&P 500 Equal Weight Index vs. S&P 500 (Price Relative) and U.S. 30-Year Bond Equity markets suggest new lows in bond yields. Image: BofA Global Investment Strategy
S&P 500 Equal Weight Index vs. S&P 500 (Price Relative) and U.S. 30-Year Bond Equity markets suggest new lows in bond yields. Image: BofA Global Investment Strategy
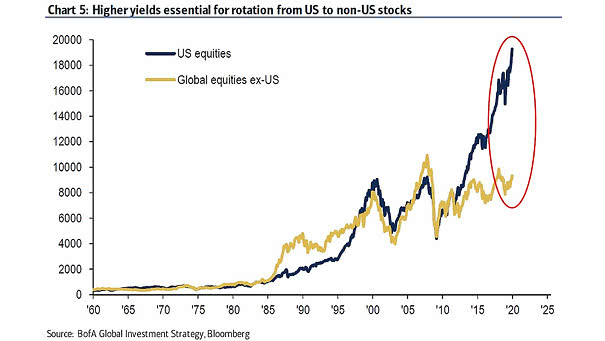
U.S. Equities and Global Equities ex-U.S. This chart suggests that higher yields could cause great rotation from bonds to stocks, US equities to non-US equities, growth to value, large caps to small caps, tech stocks to bank stocks, credit to commodities,… Image: BofA Global Investment Strategy

Historical Returns of Stocks and Bonds by Decade The next decade could see anemic returns, due to low growth, low yields and low inflation expectations. Image: Morningstar
Morgan Stanley Forecasts a Subdued Decade for Market Returns Morgan Stanley forecasts anemic returns over the next 10 years, due to low yields, low growth and low inflation expectations. Image: Financial Times
Private Debt Assets Under Management Private debt assets under management have tripled over the past decade to $812 billion. Investors are looking to increase yield in a world of low interest rates. Image: Goldman Sachs Global Investment Research
Global Supply of Safe Assets by Country – Shortage of Government Bonds The global shortage of government bonds is going to get worse and could keep yields low or negative. Image: Financial Times
Outlook for Portfolio Returns Over the Next 10 Years Chart suggesting anemic returns over the next 10 years, due to low yields, low growth and low inflation expectations. Image: Morgan Stanley Research
U.S. 60/40 Portfolio Returns Over the Next 10 Years Chart suggesting that the return of a U.S. 60/40 portfolio could slide near 100-year lows over the next decade, due to low yields, low growth and low inflation expectations. Image: Morgan Stanley Research
U.S. Dollar and S&P 500 Equity Risk Premium Higher bond yields reduce the S&P 500 equity risk premium, which weakens the U.S. dollar. Image: Morgan Stanley Research
U.S. Treasuries Volatility Curve Short-term periods of inversion have been followed by higher U.S. Treasuries yields and tighter credit spreads. Image: Arbor Research & Trading LLC