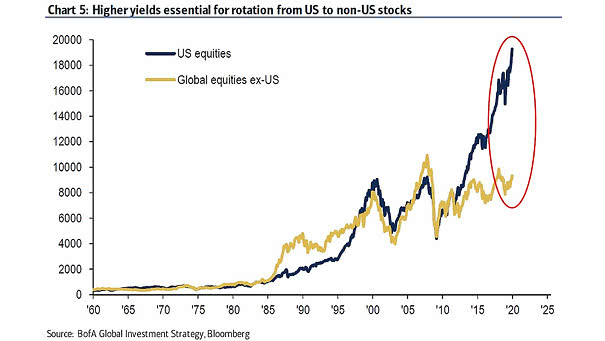
U.S. Equities and Global Equities ex-U.S.
U.S. Equities and Global Equities ex-U.S. This chart suggests that higher yields could cause great rotation from bonds to stocks, US equities to non-US equities, growth to value, large caps to small caps, tech stocks to bank stocks, credit to commodities,… Image: BofA Global Investment Strategy