Can The U.S. 10-Year Treasury Yield Fall Further?

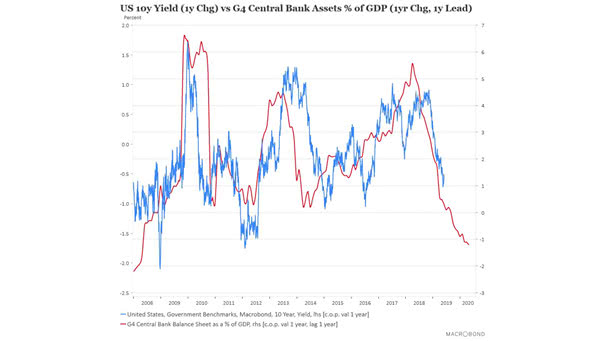
Can The U.S. 10-Year Treasury Yield Fall Further? Well, according to this chart, the U.S. 10-year treasury yield could fall further. The chart suggests that G4 central bank assets as percentage of GDP (1-year change) lead U.S. 10-year Treasury yield (1-year change) by one year. Image: Macrobond

The Amount of Outstanding Negative-Yielding Debt since 2009

The Amount of Outstanding Negative-Yielding Debt since 2009 Investors are paying governments for the privilege of holding their bonds and are losing so much money in real terms. Raising interest rates in the future could be painful for bond investors. Image: Jeroen Blokland, Bloomberg

US Long-Term Mortgage Rates Decline: 30-Year Average 4.10% & 15-Year Average 3.57%

US Long-Term Mortgage Rates Decline: 30-Year Average 4.10% & 15-Year Average 3.57% Why US long-term mortgage rates decline? Mortgage costs are influenced by the 10-year Treasury yield which was lower this week, because the trade war between the United States and China pushes investors moving money from stocks to bonds. Bond yields fall as prices rise.…

Europe’s Stocks Are Really Unloved

Europe’s Stocks Are Really Unloved Europe’s benchmark has lagged other major ones in recent years. But on the positive side: the valuation is low, Europe will not disintegrate, the rotation from bonds to equities has not yet begun, and there is a fairly good growth in 2019. Image: Bloomberg

Are We Near a Recession?

Are We Near a Recession? “The leading index for each state predicts the six-month growth rate of the state’s coincident index. In addition to the coincident index, the models include other variables that lead the economy: state-level housing permits (1 to 4 units), state initial unemployment insurance claims, delivery times from the Institute for Supply…

Why a Low or Negative Equity Risk Premium Coincides with a Temporary Market Peak?

Why a Low or Negative Equity Risk Premium Coincides with a Temporary Market Peak? Because it pushes investors into bonds rather than equities. This was the case in 1973, 1981, 2000, 2007 and 2018 before the market crash. The current equity risk premium is available to our subscribers. Our equity risk premium model has a great 96% correlation with…