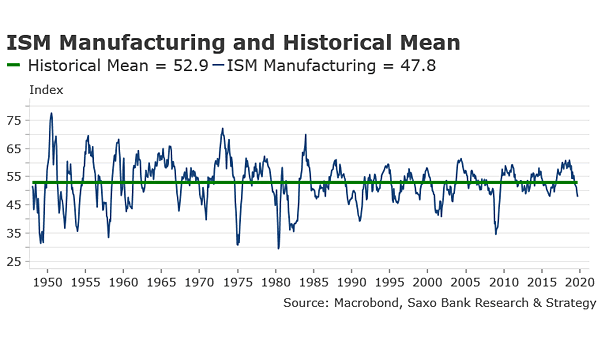
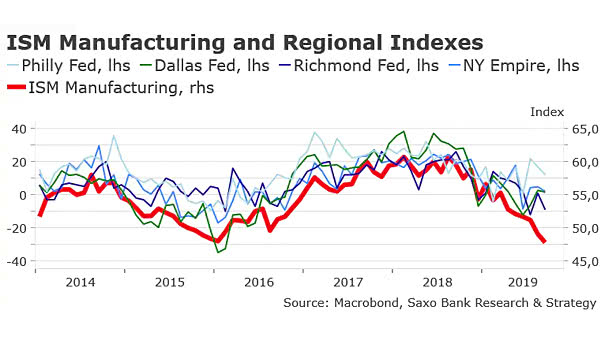
Job Openings and Average Weekly Hours

Job Openings and Average Weekly Hours The number of job openings fell in August, mirroring the decline in average weekly hours, and confirming that the U.S. labor market is cooling. Image: TD Bank Financial Group

China GDP vs. U.S. GDP

China GDP vs. U.S. GDP Chart suggesting that China GDP will overtake U.S. GDP by 2030. Image: Danske Bank Research

China GDP Growth

China GDP Growth China GDP growth is expected to continue to decline significantly in the coming years, with consumption becoming the main driver of growth. Image: Danske Bank Research

Inequality – U.S. Gini Coefficient for Households

Inequality – U.S. Gini Coefficient for Households U.S. inequality reached highest level since 1967. Gini coefficient: 0 equals perfect equality, while 1 equals perfect inequality. Image: Deutsche Bank Global Research

U.S. Health Care Costs

U.S. Health Care Costs U.S. health care costs have skyrocketed and are higher than in any other country Image: Deutsche Bank Global Research

U.S. ISM Composite Index and U.S. Real GDP

U.S. ISM Composite Index and U.S. Real GDP This chart shows the good correlation between the ISM Composite Index (services + manufacturing) and U.S. real GDP. What about U.S. GDP growth in 2020? Image: Deutsche Bank Global Research

China and Taiwan Manufacturing PMI

China and Taiwan Manufacturing PMI The charts suggest a bottom in the Chinese and Taiwanese cycle in early 2020. Historically, this has been positive for global equities. Image: Danske Bank Research