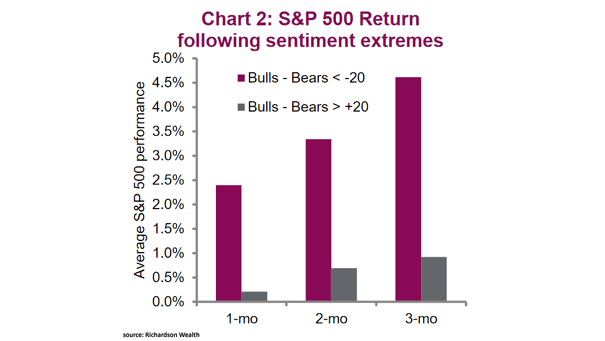
AAII Bull/Bear Survey – S&P 500 Return Following Sentiment Extremes
AAII Bull/Bear Survey – S&P 500 Return Following Sentiment Extremes Elevated sentiment like today suggests lower future returns. Image: Richardson Wealth
AAII Bull/Bear Survey – S&P 500 Return Following Sentiment Extremes Elevated sentiment like today suggests lower future returns. Image: Richardson Wealth
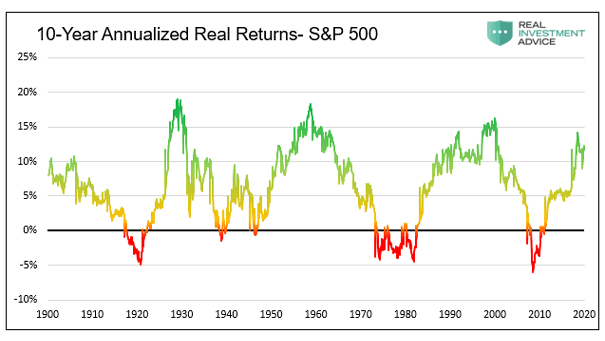
S&P 500 – 10-Year Annualized Real Returns Returns tend to be cyclical. Buying the S&P 500 at high valuations has led to poor future returns. Image: Real Investment Advice

Estimated S&P 500 Earnings Impact of Biden Policies Chart suggesting that there are both upside and downside risks to future S&P 500 earnings. Image: Goldman Sachs Global Investment Research
Health Care Sector Excess Returns vs. S&P 500 Around U.S. Presidential Elections The health care sector tends to underperform through U.S. presidential elections, due to uncertainty about future government policy. Image: Goldman Sachs Global Investment Research
Number of Times S&P 500 Fell 7% and Hit a Circuit Breaker U.S. futures and U.S. stocks have hit multiple level-one circuit breakers this year. Image: Deutsche Bank Global Research
S&P 500 Earnings and U.S. Capital Spending This chart shows that U.S. core capital spending is near a 20-year high. Are fears that U.S. companies may be curtailing spending plans overblown? The absence of dividend cuts also suggests that U.S. companies are confident in their future earnings potential. Image: The Leuthold Group
Spread Between 10-ROC of S&P 500 and Treasury Bonds This interesting chart shows a 10 trading day rate-of-change (ROC) for the SP500 and for near-month Treasury bond futures prices. A price low is forming now. Image: McClellan Financial Publications, Inc.
S&P 500 PE Level vs. Average 12-month Return The chart shows how market valuation affects future equity returns since 1930. You may also like “Why the Stock Market Valuation Matters Before a Recession?“ Image: Richardson Wealth
What Happens If the S&P 500 Index Is Green the First Four Months since 1950? Well, if history helps us to predict the future, the rest of year is higher 14 out of 15 times. The median pullback is -9.4%. Image: LPL Research
10-Year Treasury minus 1-Year Treasury Yield Spread vs. S&P 500 Returns If history helps us to predict the future, the 10y-1y treasury yield spread suggests low returns ahead for U.S. stocks. After 10 years of a bull market, our stock market forecasting model also shows that the market follows a different path in 2019. Statistically,…