Aggregate Commodities – Net Speculative Positions
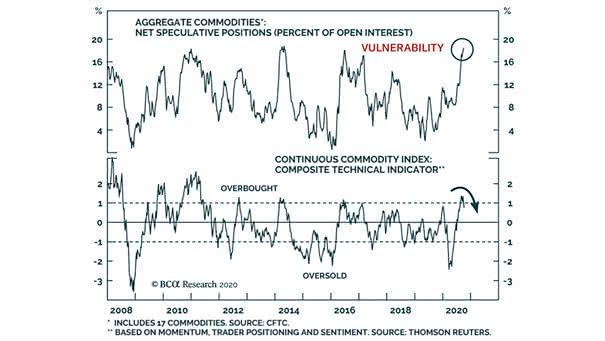
Aggregate Commodities – Net Speculative Positions Net speculative positions could suggest a correction in commodities. Image: BCA Research
Aggregate Commodities – Net Speculative Positions Net speculative positions could suggest a correction in commodities. Image: BCA Research
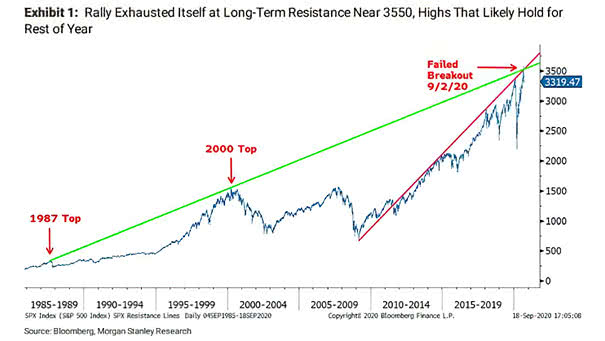
S&P 500 and Long-Term Resistance According to Morgan Stanley the correction isn’t over, as stocks get too extended. Image: Morgan Stanley Research

Equal-Weighted S&P 500 and S&P 500 Cumulative Advance/Decline Charts suggesting that a market correction may begin soon, as the S&P 500 cumulative advance/decline line fails to confirm the new all-time highs. Image: Morgan Stanley Research
U.S. Equity Strategy – Cyclicals vs. Defensives and S&P 500 Morgan Stanley suggests that the S&P 500 has potential downside to 2800-2850, as the correction in early June is likely not over. Image: Morgan Stanley Research
VIX (Volatility) and Implied Equity Risk Premium The risk of a correction is rising, as the implied equity risk premium is now below what the VIX would suggest. Image: Fidelity Investments
Valuation – MSCI ACWI Index’s 12-Month Forward Price to Earnings The risk of a correction is rising, as global stocks continue to rally and become more expensive. Image: Bloomberg
S&P 500 and Composite Momentum Indicator This chart suggests that the composite momentum indicator exposes investors to the risk of a short-term correction. Image: BCA Research
Time Taken for S&P 500 to Correct 10% from Peak The correction over the past six trading sessions is the fastest 10% decline in the S&P500 from a record high. Image: Deutsche Bank Global Research
S&P 500 Drawdowns – Average Corrections since WW2 The recent correction has been sharper than the average since WW2, with the S&P 500 going to correction territory in a few days. Image: Goldman Sachs Global Investment Research
S&P 500 Forward Return and Two Consecutive 3% Declines This table suggests that the current sell-off is a correction in a bull market. Image: Fundstrat Global Advisors, LLC
U.S. GDP and S&P 500 This interesting chart puts market corrections and U.S. GDP in perspective. Image: Oxford Economics, Macrobond