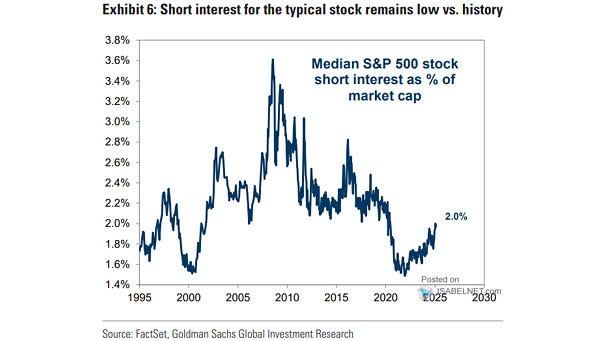
Median S&P 500 Stock Short Interest as % of Market Capitalization
Median S&P 500 Stock Short Interest as % of Market Capitalization The S&P 500’s median short interest level is low at 1.8%, suggesting that market participants are largely optimistic or, at least, not significantly bearish regarding its future performance. Image: Goldman Sachs Global Investment Research