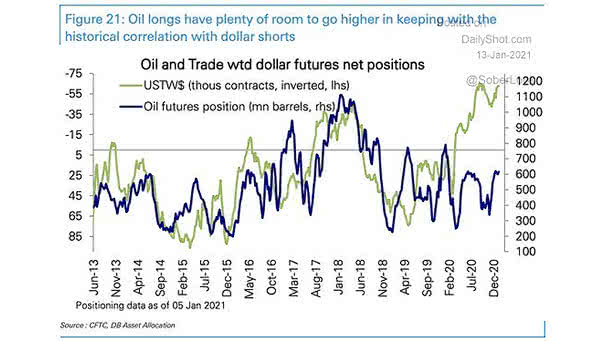
Oil and Trade Weighted Dollar Futures Net Positions
Oil and Trade Weighted Dollar Futures Net Positions Historically, the U.S. dollar has tended to be inversely correlated with oil price movements. Image: Deutsche Bank Asset Allocation
Oil and Trade Weighted Dollar Futures Net Positions Historically, the U.S. dollar has tended to be inversely correlated with oil price movements. Image: Deutsche Bank Asset Allocation
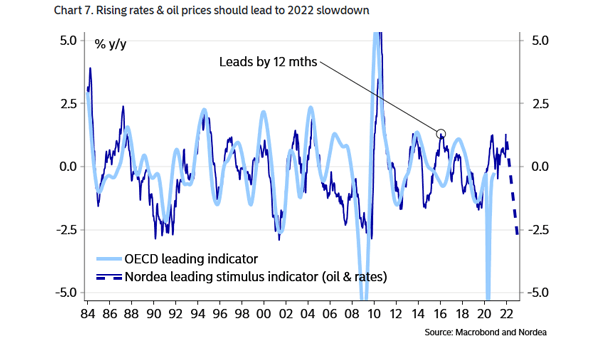
OECD Leading Indicator and Leading Stimulus Indicator (Oil and Rates) Changes in oil prices and yields could have an impact on the OECD leading indicator during the year 2022. Image: Nordea and Macrobond

U.S. Five-Year Inflation Swap and WTI Oil Chart suggesting the correlation between inflation expectations and oil prices. Image: Morgan Stanley Wealth Management
WTI Crude Oil vs. S&P 500 Energy Index U.S. energy stocks continue to trade at low levels relative to crude oil prices. Image: Morgan Stanley Wealth Management
Crude Oil Forecasts Goldman Sachs expects oil prices to decline from current levels. Image: Goldman Sachs Global Investment Research
WTI Crude Oil and Headline CPI Inflation This chart suggests that falling oil prices could easily lead to deflation. Image: J.P. Morgan
The Cost of a Barrel of Oil in Real U.S. Dollar Terms This chart puts into perspective the real price of oil in U.S. dollar terms since 1870. U.S. oil prices turned negative for the first time in history. Image: Deutsche Bank
Returns for WTI Crude Oil Futures and MSCI Emerging Markets Index The WTI crude oil price tends to reflects EM fundamentals. Image: Nomura
WTI Crude Oil Plunges Below Zero This chart shows the price of WTI crude oil below zero for the first time in history. Image: Financial Times
Global Oil Consumption as a % of GDP and Global Recessions Chart suggesting that Brent crude prices need to exceed US$117 to push the global economy into recession. Image: Financial Times
Brent 5-Year Futures Price This chart shows that long-dated oil prices stayed relatively flat after attacks on Saudi Arabia’s oil infrastructure. Image: Goldman Sachs Global Investment Research