U.S. Corporate Income Tax Rate

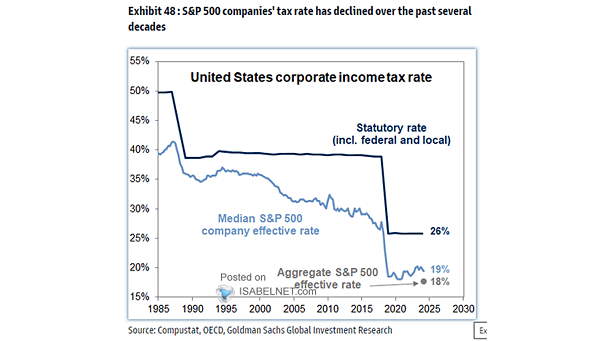
U.S. Corporate Income Tax Rate The trend of declining effective tax rates among S&P 500 companies reflects broader economic shifts and policy decisions that have shaped the landscape of corporate taxation in the United States. Image: Goldman Sachs Global Investment Research
S&P 500 and Odds of Winning U.S. Presidential Election

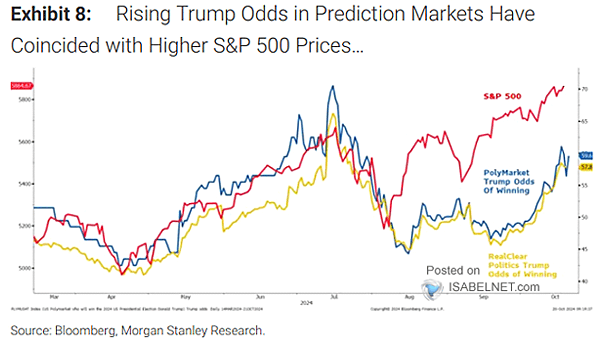
S&P 500 and Odds of Winning U.S. Presidential Election The rising odds for Trump in prediction markets have been closely tied to an upswing in S&P 500 prices, reflecting investor sentiment that aligns with potential changes in economic policy should he win the election. Image: Morgan Stanley Research

U.S. Money Market Fund Assets and Fed Funds Rate

U.S. Money Market Fund Assets and Fed Funds Rate The current environment suggests that a substantial amount of capital is poised to flow back into equity markets, driven by expectations of favorable economic conditions and monetary policy adjustments. Image: Goldman Sachs Global Investment Research

Treasury QT

Treasury QT The current context suggests that QT can continue even as the Fed begins to cut interest rates, provided that these cuts do not push the policy rate below what is considered neutral. Image: Deutsche Bank

Inflation – U.S. Core PCE

Inflation – U.S. Core PCE The GS Core Inflation Tracker currently remains below the Federal Reserve’s target of 2%, which is a crucial component of its monetary policy aimed at ensuring price stability and anchoring inflation expectations. Image: Goldman Sachs Global Investment Research

Implied Fed Funds Target Rate

Implied Fed Funds Target Rate The dot plot shows a median projection for the federal funds rate to decrease to 4.38% by the end of 2024 and further down to 3.38% by the end of 2025, signaling a shift towards a more accommodative monetary policy. Image: Bloomberg

2-Year U.S. Treasury Yield – Fed Funds Rate

2-Year U.S. Treasury Yield – Fed Funds Rate The current spread between the 2-year U.S. Treasury yield and the federal funds rate suggests that the bond market perceives the Federal Reserve’s monetary policy as tight. Image: Morgan Stanley Wealth Management

Seasonality – Average Daily Performance of the S&P 500

Seasonality – Average Daily Performance of the S&P 500 Although the S&P 500 benefits from robust earnings growth and positive expectations for monetary policy, U.S. stocks often experience weakness in September and October. Image: Deutsche Bank

Weekly Energy Flows

Weekly Energy Flows Energy funds are facing substantial outflows, driven by investor concerns over growth and policy uncertainties. Image: BofA Global Investment Strategy

Fed Funds vs. 2-Year U.S. Treasury Yield (Leading Indicator)

Fed Funds vs. 2-Year U.S. Treasury Yield (Leading Indicator) The current 2-year U.S. Treasury yield, which is below the federal funds rate, indicates that the Fed’s monetary policy is restrictive. Furthermore, the 2-year yield typically leads the fed funds rate by about 20 weeks. Image: Morgan Stanley Research

Federal Funds Rate

Federal Funds Rate By aligning market expectations with its policy intentions, the Fed minimizes surprises in the fed funds rate relative to market pricing at the start of the blackout period, thereby reducing the likelihood of market disruptions. Image: Deutsche Bank