Strong Dollar and Imports
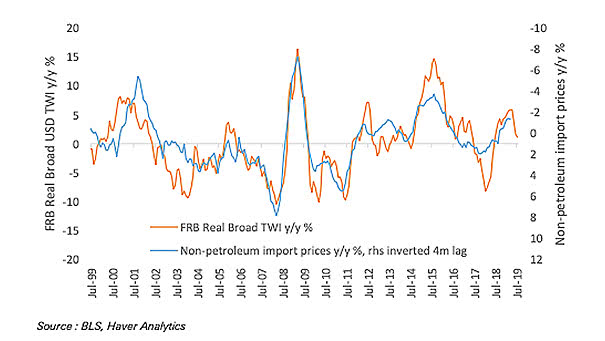
Strong Dollar and Imports The chart shows that a stronger dollar depresses goods prices via imports. Image: Deutsche Bank Global Research
Strong Dollar and Imports The chart shows that a stronger dollar depresses goods prices via imports. Image: Deutsche Bank Global Research
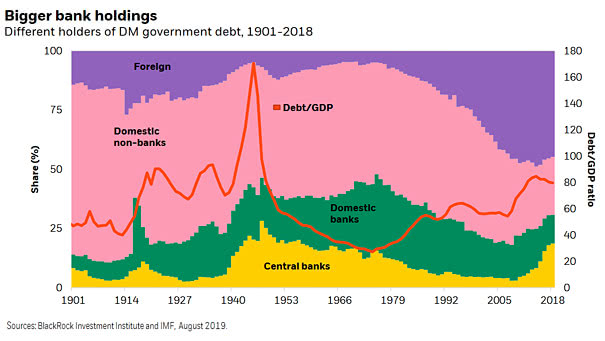
Different Holders of DM Government Debt The chart shows the historical breakdown of different holders of DM government bonds and overall DM debt-to-GDP. Even with QE, central bank government bond holdings are below historical peaks. Image: BlackRock Investment Institute

U.S. Private Sector Yield Curve Currently, the U.S. private sector yield curve (20-year Baa bonds/bank prime rate) is the most inverted since October 2007. Image: GnS Economics
Who Owns Different Countries’ Government Bonds? About 70% of the U.S. national debt is owned by domestic government, institutions investors and the Federal Reserve. Image: Deutsche Bank Global Research
Total Number of Governments since 1945 Italy and France have the largest number of governments since 1945, while the U.S. and Luxembourg have the smallest number. Image: Deutsche Bank Global Research
A Hall of Mirrors in Monetary Policy? This chart suggests a feedback loop between bond market pricing and central bank decisions. Image: Goldman Sachs Global Investment Research
U.S. Leading Economic Indicators (LEI) and Fed Insurance Rate Cuts This chart shows that Fed insurance rate cuts can be good news when the U.S. economy slows down. Image: Scotiabank
S&P 500 Performance by President, from Reagan to Trump For President Trump, the stock market is a scorecard. This chart shows the S&P 500 performance across different presidencies, from Reagan to Trump. Image: Deutsche Bank
U.S. Yield Curve 18 Months Before Presidential Elections 18 months before presidential elections, a flatter yield curve suggests a greater tendency to predict a change away from the incumbent President’s party Image: Deutsche Bank
Gold vs. U.S. 10-Year Real Yield The chart shows the nice correlation between the U.S. 10-year real yield (inverted) and the price of gold as a defensive asset Image: Saxo Bank
Liquidity in U.S. Equity Futures Liquidity in U.S. equity futures collapsed in early 2018. It has remained at very low levels. The lack of liquidity could lead to violent market moves. Image: Deutsche Bank