U.S. Budget Deficits and the U.S. Dollar
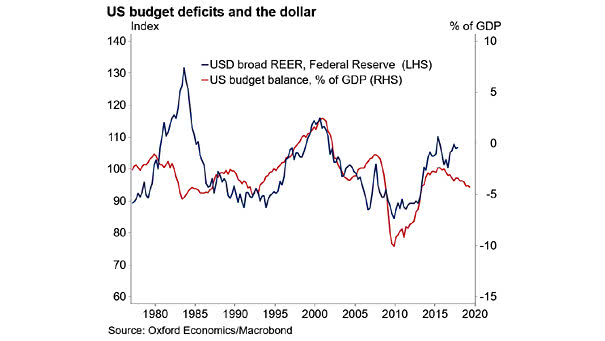
U.S. Budget Deficits and the U.S. Dollar Pretty good correlation between U.S. budget deficits and the U.S. dollar over the past 30 years. The chart suggests that the U.S. dollar should weaken over time. You may also like “U.S. Twin Deficits (% of GDP) Lead Real Trade Weighted Dollar Index by Two Years” and “U.S. Dollar…