S&P 500 Dividend Yield and 30-Year Treasury Bond

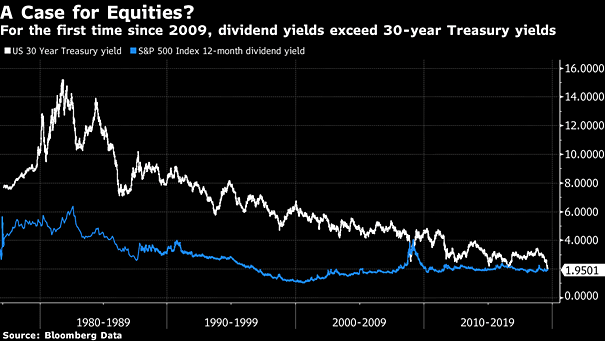
S&P 500 Dividend Yield and 30-Year Treasury Bond Are U.S. equities a “buy”? The dividend yield of the S&P 500 Index is now higher than the yield from a 30-year Treasury bond. This is a rare phenomenon. But the equity risk does not disappear because a company pays a dividend. Image: Bloomberg

The Impact of an Inverted Yield Curve

The Impact of an Inverted Yield Curve Great charts showing that a flat/inverted yield curve implies weaker U.S. GDP growth, lower equity returns, and higher volatility. Image: Pictet Asset Management

Risk Parity Funds

Risk Parity Funds Currently, risk parity equity allocations are near the top of the historical range. Image: Deutsche Bank Global Research

First, Middle, Final Years of S&P 500 Bull Markets since 1975

First, Middle, Final Years of S&P 500 Bull Markets since 1975 The chart shows that the S&P 500 has generated a 26.9% return on average, in the final years of bull markets since 1975, excluding the current bull market. You may also like “Equity Market Performance Around Bear Markets.” Image: Legg Mason

Time, Diversification and the Volatility of Returns

Time, Diversification and the Volatility of Returns This chart shows how the volatility of returns decreases over time (range of equity, bond and blended total return). Picture Source: J.P. Morgan Asset Management

S&P 500 PE Level vs. Average 12-month Return

S&P 500 PE Level vs. Average 12-month Return The chart shows how market valuation affects future equity returns since 1930. You may also like “Why the Stock Market Valuation Matters Before a Recession?“ Image: Richardson Wealth

Citigroup Economic Surprise Index vs. 10-Year Treasury Yield

Citigroup Economic Surprise Index vs. 10-Year Treasury Yield This chart shows a good correlation between Citigroup Economic Surprise Index and 10-year Treasury yield. Lower yields ahead? You may also like “For the Last Few Years, Equity Markets Have Been Leading Bond Markets.” Image: Yardeni Research, Inc.

Probability of US Recession is Rising

Probability of US Recession is Rising Mike Wilson, chief U.S. equity strategist for Morgan Stanley, said that “Fed could cut as soon as July but it may not halt slowdown/recession.” Image: U.S. Global Investors

50 Percent of US Stock Fund Assets Are Invested in Index Funds

50 Percent of US Stock Fund Assets Are Invested in Index Funds Until active equity funds drop fees, the flow into passive equity funds will certainly continue. But could markets become inefficient if everyone buys index funds? Image: Morningstar

Investor Movement Index vs. S&P 500

Investor Movement Index vs. S&P 500 The Investor Movement Index indicates the sentiment of TD Ameritrade retail investors. Thus, retail investors are net buyers of equities when the stock market is expensive, and they are net sellers of equities when the stock market is cheap. As usual, retail investors react to equity price movements. They buy and sell…