
Is the U.S. Expansion Waning?
Is the U.S. Expansion Waning? Despite strong US GDP growth in April 2019, this chart shows that U.S. growth is not bouncing back in this late business cycle. Image: Goldman Sachs Investment Research
Is the U.S. Expansion Waning? Despite strong US GDP growth in April 2019, this chart shows that U.S. growth is not bouncing back in this late business cycle. Image: Goldman Sachs Investment Research
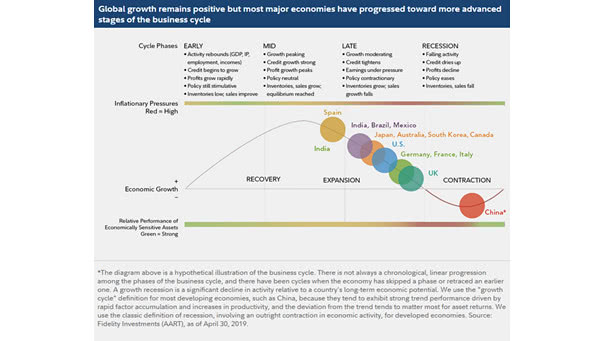
Stages of the Business Cycle as of April 30, 2019 Although global growth remains positive, this chart suggests that most major economies are entering the late business cycle phase. Image: Fidelity Investments

Should Investors Be Concerned About Rising Oil Prices? Because the U.S. becomes entirely self-sufficient, it helps to contain oil prices in the long-term. Cheap oil is good for global economic growth, business and consumers. Image: J.P. Morgan Asset Management
Do Central Banks’ Negative Rates Work in Europe? Not really. Actually, negative rates distort economies and leave little room to maneuver in the next recession. Secondly, extremely low interest rates are also bad for European banks, like Deutsche Bank, which in turn is bad for economic growth. It’s a feedback loop which could lead to…
What’s The Risk Of An Earnings Recession in 2019? Maybe Less Than You May Think US-China trade uncertainty is the enemy of growth, and the impact of tariffs will weigh on corporate profits. But it looks like we’ll avert an earnings recession in 2019 if a trade deal with China is reached this summer. Image:…
Stock Market Forecasting Models vs. US Stock Market – Growth of $1,000 As an example, the chart shows the growth of $1,000 since 1970, between the stock market forecasting models and the US stock market (compound return before taxes, fees and transactions costs – unleveraged, simulated long & short trades – quarterly basis & logarithmic…
The Stock Market Continues to Climb the Wall of Worry There is always a good reason not to invest in the stock market, but you may miss a significant portion of your capital growth. Image: Bank of America Merrill Lynch
How to Get Inflation? Mainly, inflation comes from excess money supply growth. There is too much money in the system chasing too few goods and services. Nominal GDP = M x V = P x T M = quantity of money V = velocity of circulation of money P = level of prices T =…
Europe’s Stocks Are Really Unloved Europe’s benchmark has lagged other major ones in recent years. But on the positive side: the valuation is low, Europe will not disintegrate, the rotation from bonds to equities has not yet begun, and there is a fairly good growth in 2019. Image: Bloomberg
Are We Near a Recession? “The leading index for each state predicts the six-month growth rate of the state’s coincident index. In addition to the coincident index, the models include other variables that lead the economy: state-level housing permits (1 to 4 units), state initial unemployment insurance claims, delivery times from the Institute for Supply…
When Is the Next Recession Coming? If history helps us to predict the future, a recession can occur when: Wage Growth minus Fed Funds Rate is below -1%. Why? Because the Fed is too tight at that moment. Since 1965, a recession has never occurred until Wage Growth minus Fed Funds Rate was below -1%…