S&P 500 Index Market Capitalization, YTD Performance
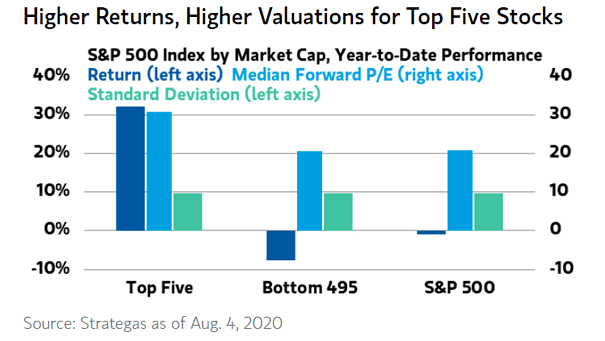
S&P 500 Index Market Capitalization, YTD Performance Higher returns YTD, but higher valuations for the top five stocks. Image: Morgan Stanley Wealth Management
S&P 500 Index Market Capitalization, YTD Performance Higher returns YTD, but higher valuations for the top five stocks. Image: Morgan Stanley Wealth Management
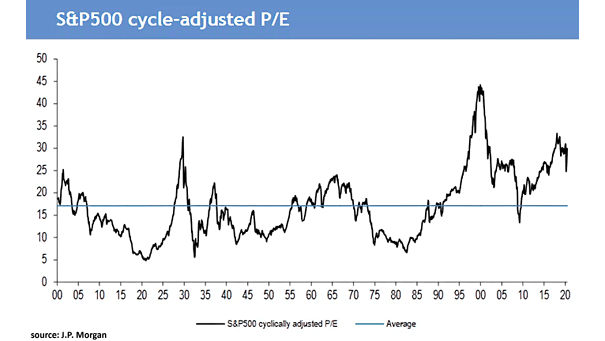
S&P 500 Cycle-Adjusted P/E The S&P500 cycle-adjusted P/E is now 29.9 and 75% above its long-term average, suggesting weak equity returns over the next 10 years. Image: J.P. Morgan

S&P 500 and 3-Month Seasonality The S&P 500 tends to get a summer rally, as the second strongest 3-month period of the year is June-August, with an average return of 3.05%. Image: BofA Global Research
Flows into Inflation Protection ETFs Inflation protection ETFs see record inflows as investors predict inflation return. Image: Arbor Research & Trading LLC
All Weather Portfolio (Stocks, Bonds, Cash and Gold) The All Weather Portfolio of 25/25/25/25 in stocks, bonds, cash and gold is up 18% over the past 90 days, the highest return ever. Image: BofA Global Investment Strategy
Valuation – Defensive Assets vs. Assets More Sensitive to the Economy Valuations suggest that we’re a long way from a return to normal times, as the market remains concerned about long-term growth. Image: Morgan Stanley Research
U.S. Elections – Dow Jones vs. Presidential Political Party Republicans vs. Democrats: this chart shows that Dow Jones returns have been much better when a Democrat held the presidency. Image: Ned Davis Research
S&P 500 Long-Term Perspective In times of uncertainty, this chart puts into perspective the long-term returns of the S&P 500 since 1880. Image: BCA Research
S&P 500 (SPY) After Hours vs. Regular Trading Performance This year, market returns were achieved during regular trading hours. Buying the open (SPY) and selling the close: +16.9% YTD (for informational purpose only, not investment advice). Image: Bespoke Investment Group
Inflation in this Cycle (DM GDP Deflator) Morgan Stanley expects the return of inflation after the Great COVID-19 Recession (GCR). Image: Morgan Stanley Research