ISM Manufacturing Index and U.S. 10-Year Treasury Bond Yield
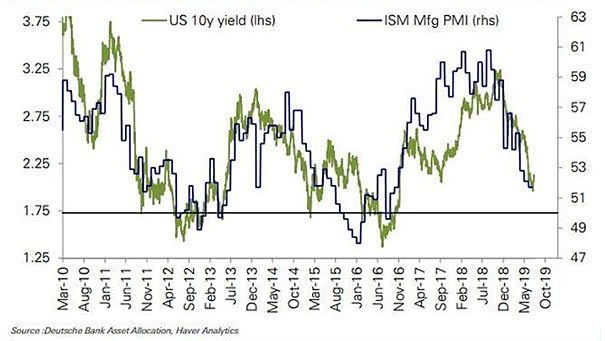
ISM Manufacturing Index and U.S. 10-Year Treasury Bond Yield The decline in U.S. 10-year Treasury bond yields has been in line with falling ISM PMI. Picture Source: Deutsche Bank
ISM Manufacturing Index and U.S. 10-Year Treasury Bond Yield The decline in U.S. 10-year Treasury bond yields has been in line with falling ISM PMI. Picture Source: Deutsche Bank
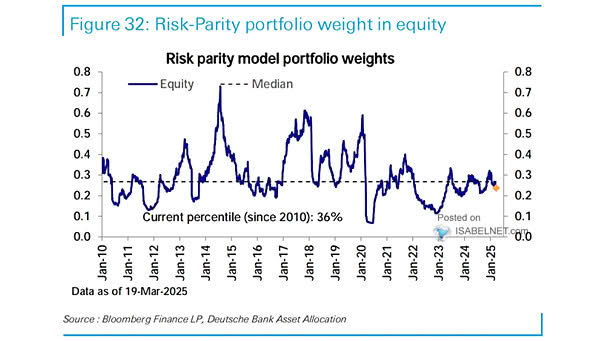
Risk Parity Funds Currently, risk parity equity allocations are near the top of the historical range. Image: Deutsche Bank Global Research

Share of Negative Yielding Bonds in the World Excluding U.S. The chart shows that 43% of global bonds ex-U.S. trade at negative yields. Image: Deutsche Bank Global Research
ISM Manufacturing Index vs. S&P 500 The U.S. stock market is pricing in a strong rebound in the ISM Manufacturing Index (R² = 0.40 since 1997). Image: Deutsche Bank
ISM Manufacturing Index Surrounding FED Easing Cycles The chart shows that the trend of the ISM Manufacturing Index is quite similar to past cycles before first Fed rate cut. Image: Deutsche Bank
FedEx Stock Price Leads World Trade Volume by Three Months This chart suggests that FedEx is usually a good leading indicator of the world economy. You may also like “FedEx vs. World Trade.” Image: Deutsche Bank Global Research
Negative Yielding Bonds In the World Now, 25% of all bonds in the world trade at negative interest rates. Keep in mind that raising interest rates in the future could be painful for bond investors. Image: Deutsche Bank Global Research
Global Nominal GDP After the U.S., China is the world’s second largest economy. Its nominal GDP represents 16% of world GDP, compared to 24% for the United States. Image: Scotiabank
U.S. 10-Year Treasury Yield vs. Fed Rate Interesting chart showing that the U.S. 10-year treasury yield usually does not bottom until the Fed has finished cutting rates. Image: Deutsche Bank
Global Fixed Income Market In Different Yield Buckets Nowadays, the scarcity of yield with 20% of global bonds below 0%. Image: ICE Data Indices, Bank of America Merrill Lynch