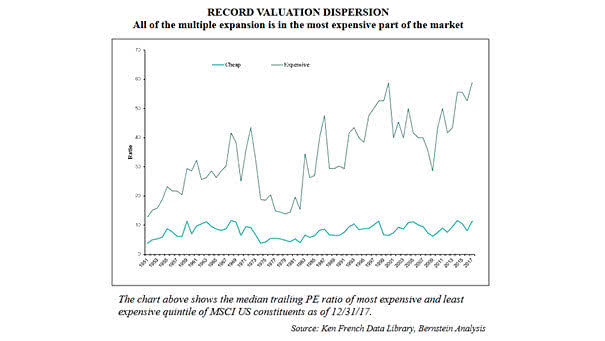
S&P 500 Cyclicals Relative to Defensives
S&P 500 Cyclicals Relative to Defensives Chart suggesting that S&P 500 cyclicals could outperform defensives in 2020, based on higher U.S. nominal GDP growth. Image: Stifel
U.S. Stock-to-Bond Ratio Leads U.S. Real GDP Chart suggesting that the U.S. stock-to-bond ratio leads U.S. real GDP by 6 months, which could indicate higher GDP growth. Image: Alpine Macro
ISM Non-Manufacturing Index, ISM Manufacturing Index and U.S. GDP U.S. ISM indices suggest a slowdown in the US growth rate, but not an imminent recession. Image source: ING Economics
S&P 500 EPS Forecast Despite the earnings squeeze, Goldman Sachs is still positive on the S&P 500 earnings outlook. In 2020, U.S. and global growth should rebound modestly. Image: Goldman Sachs Global Investment Research
U.S. 60/40 Portfolio Returns Over the Next 10 Years Chart suggesting that the return of a U.S. 60/40 portfolio could slide near 100-year lows over the next decade, due to low yields, low growth and low inflation expectations. Image: Morgan Stanley Research
U.S. Real GDP Forecast for 2019 and 2020 Wells Fargo does not yet see a recession in the U.S. and forecasts U.S. real GDP growth of 2.2% in 2019 and 1.7% in 2020 (as of October 2019). Image: Wells Fargo Securities, LLC
S&P 500 vs. IPO Performance The chart shows how IPOs have performed since 2015. Currently, investors seem reluctant to invest in high-risk, high-growth companies. Image: Richardson Wealth
Construction Sector Activity and Recessions This chart clearly shows that growth of activity in the construction sector is slowing down. Image: Quill Intelligence, LLC
U.S. Equity Fund Flows vs. Bonds and Cash This chart puts into perspective the rotation from equities to bonds and cash, as investors become cautious about further growth. Image: Goldman Sachs Global Investment Research
Earnings Estimate Progression This chart shows the earnings estimate progression since 2013. For this year, the consensus estimate of EPS growth is currently around 1.9%, and around 9.7% for 2020. Image: Fidelity Investments