S&P 500 with NYSE 90% Up Days
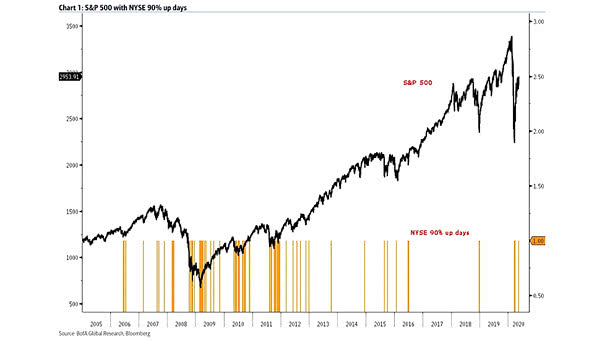
S&P 500 with NYSE 90% Up Days Historically, S&P 500 returns after an NYSE 90% up day are positive 80% of the time after 20 days. Image: BofA Global Research
S&P 500 with NYSE 90% Up Days Historically, S&P 500 returns after an NYSE 90% up day are positive 80% of the time after 20 days. Image: BofA Global Research
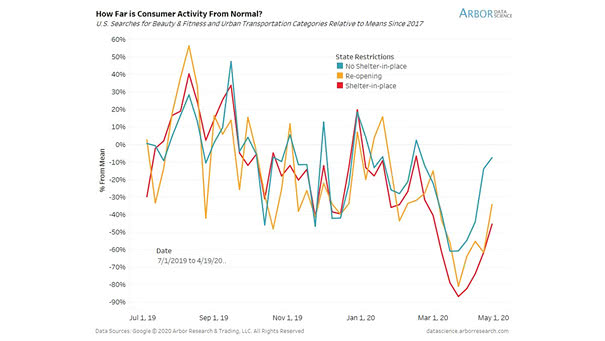
How Far is U.S. Consumer Activity From Normal? U.S. searches for beauty & fitness and urban transport suggest consumers are returning. Image: Arbor Research & Trading LLC

S&P 500 and 10% Monthly Gains, What Happens Next? Historically, 10% monthly gains for the S&P 500 have led to continued strong returns. Image: LPL Research
Breakeven Prices for Existing U.S. Oil Wells Breakeven prices for existing U.S. oil wells highlights that the current WTI oil price is too low for oil companies to make a decent return. Image: Federal Reserve Bank of Dallas Energy Survey
Market Crash Timeline: Growth of $1 and the U.S. Stock Market’s Real Peak Values This chart shows that patience is key for investment returns, as market crashes are frequent. Image: Morningstar
S&P 500 – Weekly Equity Fund Flow Unusual weekly equity fund outflows increase the likelihood of a positive return over the next 1 to 12 months. Image: Sentimentrader
Inflation-Adjusted Investment in U.S. Stock Market This chart puts into perspective the long-term trend of the S&P 500 Total Return adjusted for CPI inflation (real CAGR = 6.7%). Image: Hondo Tomasz
Valuation of Global Equities When valuation of global equities is this low, returns are typically positive Image: Goldman Sachs Global Investment Research
Bull and Bear Markets This chart shows the S&P 500′s returns in bull and bear markets through history. Image: CNBC
S&P 500 and NYSE Down Volume Ratio Four of the past nine days have seen NYSE down volume ratio above 88%. Historically, the S&P 500 rallied every time over the next year, with a median return of 24.3% since 1962. Image: Sentimentrader