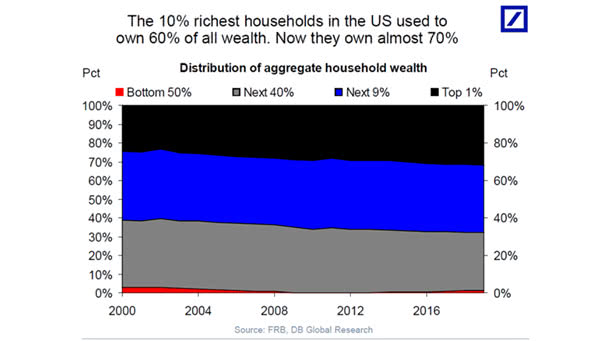
The 10% Richest Households in the U.S. Own Almost 70% of All Wealth
The 10% Richest Households in the U.S. Own Almost 70% of All Wealth The 10% richest households in the US used to own 60% of all wealth. Now they own almost 70%. Inequality: you may also like “U.S. Net Worth by Wealth Bracket.” Image: Deutsche Bank Global Research