Is Trump Right to Criticize Powell?
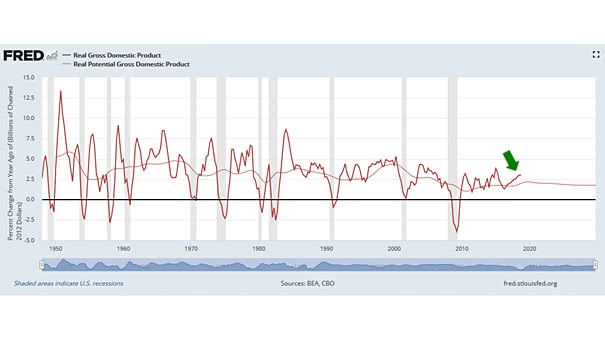
Is Trump Right to Criticize Powell? We don’t think so, because: – Interest rates are still near zero in real terms and below real GDP – The rise in Fed rates has very few visible negative effects in the USA – And at full employment, GDP returns to the level of potential GDP