Earnings, Margins and Valuation
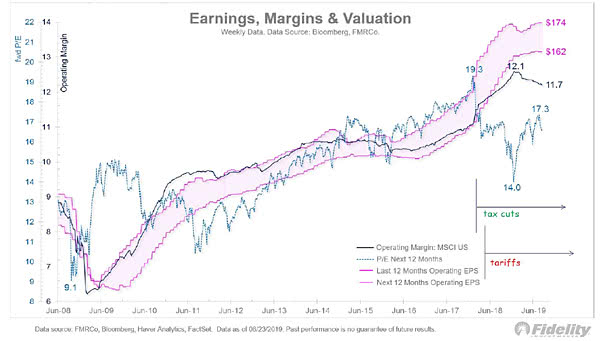
Earnings, Margins and Valuation Considering earnings growth, operating margin and valuation, the S&P 500 should remain under pressure until Q3 earnings season. Image: Fidelity Investments
Earnings, Margins and Valuation Considering earnings growth, operating margin and valuation, the S&P 500 should remain under pressure until Q3 earnings season. Image: Fidelity Investments
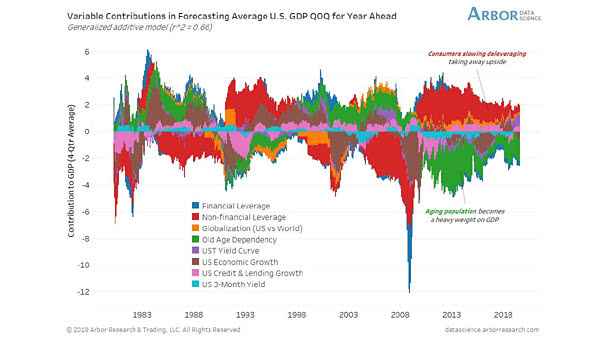
Demographics – Forecasting U.S. GDP This chart suggests that aging population is weighing down growth. Image: Arbor Research & Trading LLC

Citi Economic Surprise Index vs. EUR/USD Weaker European growth relative to the U.S. could weaken Euro/U.S. Dollar. Image: Credit Suisse
The Impact of an Inverted Yield Curve Great charts showing that a flat/inverted yield curve implies weaker U.S. GDP growth, lower equity returns, and higher volatility. Image: Pictet Asset Management
GLD Gold Holdings SPDR Gold Shares (GLD) is the world’s largest physical gold ETF. A continued growth in ETF gold holdings over a period of time could be a bullish factor. Image: State Street Global Advisors SPDR Gold Shares, Lighthouse
U.S. Budget Deficits and the U.S. Dollar Pretty good correlation between U.S. budget deficits and the U.S. dollar over the past 30 years. The chart suggests that the U.S. dollar should weaken over time. You may also like “U.S. Twin Deficits (% of GDP) Lead Real Trade Weighted Dollar Index by Two Years” and “U.S. Dollar…
Leading Economic Indicators (LEI): U.S. vs. Global Leading economic indicators appear to be stabilizing, outside the United States. The central banks’ policy response could have a positive knock-on effect on global growth. Image: Legg Mason
U.S. 10-Year Treasury Bond Yield and U.S. 10-Year Nominal GDP The long-term trend in U.S. nominal GDP growth is a good indicator of U.S. nominal bond yields. Image: Goldman Sachs Global Investment Research
Philadelphia Semiconductor Index (SOX) Leads Global Manufacturing PMI by Three Months This chart suggests that the rally in semiconductor stocks may herald a global growth rebound. Image: Oxford Economics, Macrobond
U.S. Twin Deficits (% of GDP) Lead the U.S. Dollar Broad REER by 18 Months The chart suggests that the U.S. dollar should weaken over time. You may also like “U.S. Twin Deficits (% of GDP) Lead Real Trade Weighted Dollar Index by Two Years” and “U.S. Dollar and Relative Growth (GDP Spread)” and “U.S. Budget…