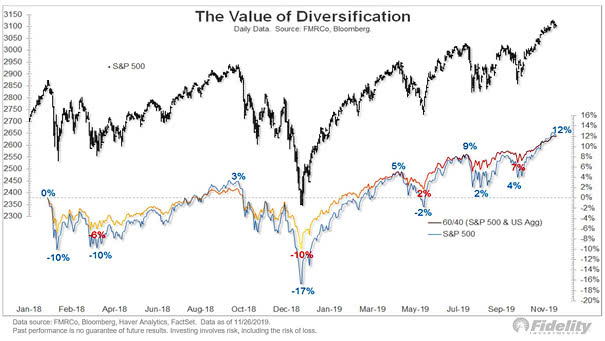
60/40 Portfolio – Bull and Bear Markets

60/40 Portfolio – Bull and Bear Markets This is the longest bull market for balanced equity/bond portfolios in over a century, without a 10% total return drawdown. Image: Goldman Sachs Global Investment

Distributions of Volatility by Countries

Distributions of Volatility by Countries This chart shows the average of 6-month rolling standard deviation of monthly returns over the last 10 years. Image: J.P. Morgan

Correlation Between S&P 500 Index and MSCI EAFE Index

Correlation Between S&P 500 Index and MSCI EAFE Index Since 1997, the high correlation between U.S. and international equity markets suggests that the MSCI EAFE may only offer a slight risk/return benefit as a complement to a U.S. equity portfolio. Image: First Eagle Investment Management, LLC

The Impact of an Inverted Yield Curve

The Impact of an Inverted Yield Curve Great charts showing that a flat/inverted yield curve implies weaker U.S. GDP growth, lower equity returns, and higher volatility. Image: Pictet Asset Management