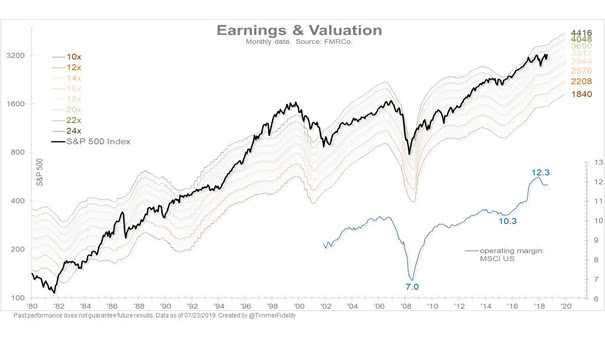
S&P 500 Index – Earnings & Valuation
S&P 500 Index – Earnings & Valuation The S&P 500 valuation is high relative to history and the earnings growth estimate has fallen to +3.7% for 2019. You may also like our “Stock Market Valuation.” Image: Fidelity Investments