Monthly Foreign Net Purchases of Long-Term U.S. Securities
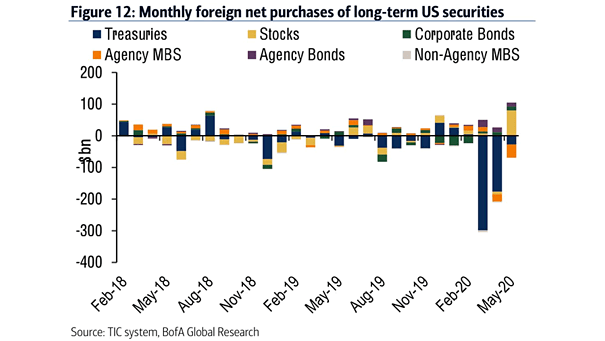
Monthly Foreign Net Purchases of Long-Term U.S. Securities Foreign investors bought long-term U.S. stocks again. Image: BofA Global Research
Monthly Foreign Net Purchases of Long-Term U.S. Securities Foreign investors bought long-term U.S. stocks again. Image: BofA Global Research
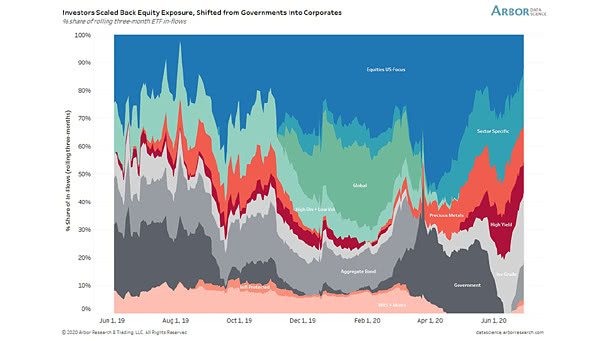
Flow – % Share of Rolling Three-Month ETF Inflows Investors reduced their equity exposure. Over the past 3 months, nearly 50% of all ETF inflows have funneled into HY, IG and Agg bonds. Image: Arbor Research & Trading LLC

Sentiment – AAII Bull/Bear Spread and S&P 500 Retail investors remain bearish, despite the market rally. Image: Morgan Stanley Research
Performance – U.S. Listed Equities That Are Popularly Traded On Retail Platforms vs. S&P 500 The favorite U.S. stocks of retail investors have outperformed the S&P 500 by a large margin since March lows. Image: BCA Research
U.S. Corporate Debt Outstanding by S&P Ratings Should investors be worried? The proportion of BBB-rated bonds has increased significantly over time. Image: Deutsche Bank Global Research
Equity Over-Valuation Composite Indicator Is the current stock market the most overvalued since 1998? 78% of FMS investors think so. Image: BofA Global Fund Manager Survey
Sentiment Indicators Relative to their 10-Year Range Chart suggesting that investor sentiment and positioning look weak overall. Image: Morgan Stanley Research
Weekly Financial Flows Financials are getting more attention from investors, as flows into the financial sector have been the largest since November 2016. Image: BofA Global Investment Strategy
S&P 500 Today vs. S&P 500 1929-1930 This chart compares the S&P 500 today vs. 1929-30. Have some investors underestimated how far the Fed would go? Image: Bloomberg
Year to Date Fund Flows Many investors placed their money in US money market funds and high yield ETFs. Image: BofA Global Research