Central Bank Balance Sheet Expansion and Local Stock Returns
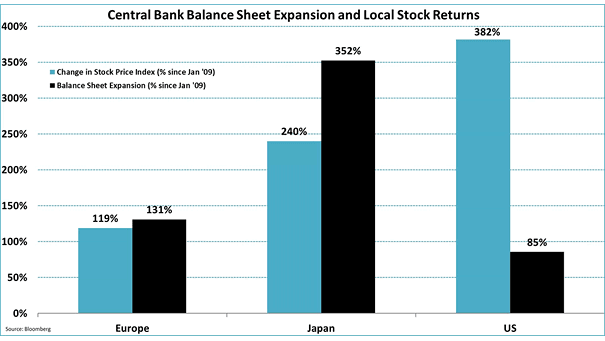
Central Bank Balance Sheet Expansion and Local Stock Returns Central bank balance sheet expansion matters, but not as much as investors think. Image: Jeroen Blokland
Central Bank Balance Sheet Expansion and Local Stock Returns Central bank balance sheet expansion matters, but not as much as investors think. Image: Jeroen Blokland
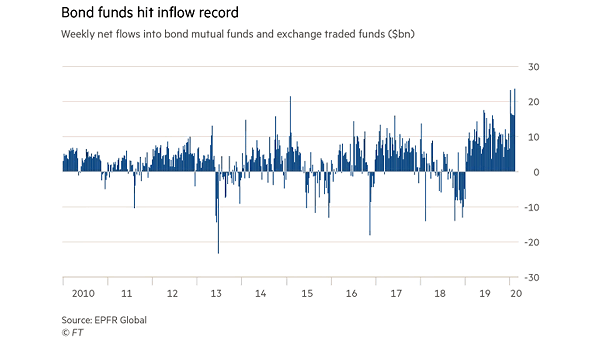
Weekly Net Flows into Bond Mutual Funds and ETFs Bond funds benefit from record inflows, reflecting investor fears about the coronavirus’s spread. Image: Financial Times

Tesla vs. The 2000 Internet Bubble While investors are betting on Tesla’s success, this chart is not a prediction on where Tesla stock is heading. Image: Nordea and Macrobond
Cumulative Fund Flows into Global Equity Funds Institutional investors are back buying stocks. Image: J.P. Morgan
Equity Positioning Indicators Equities positioning has continued to climb, as optimistic investors price in a global growth rebound. Image: Deutsche Bank Asset Allocation
Consolidated Equity Positioning Equities positioning are at their highest level in two years, as optimistic investors price in a global growth rebound. Image: Deutsche Bank Asset Allocation
AAII Bullish Sentiment 2009-2020 Optimism among individual investors is now the highest since October 2018. Image: Bespoke Investment Group
Valuation Expansion: Year-Over-Year Change in S&P 500 Forward P/E This chart suggests that investors shouldn’t expect valuation expansion this year. Image: BofA US Equity & Quant Strategy
U.S. AAII Sentiment Survey and S&P 500 This chart shows that market sentiment is important to contrarian investors. Image: Pictet Asset Management
BofA’s Fund Manager Survey Global Equity Allocation FMS investors allocation to global equities is still below 50% level, consistent with prior market tops. Image: BofA Global Fund Manager Survey