S&P 500 and Recession Probability
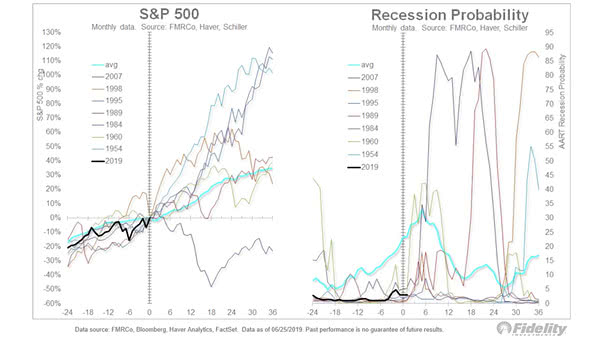
S&P 500 and Recession Probability Great chart showing twelve Fed easing cycles since the 1950s, including the recession probability and the average return of the S&P 500 Index. Image: Fidelity Investments
S&P 500 and Recession Probability Great chart showing twelve Fed easing cycles since the 1950s, including the recession probability and the average return of the S&P 500 Index. Image: Fidelity Investments
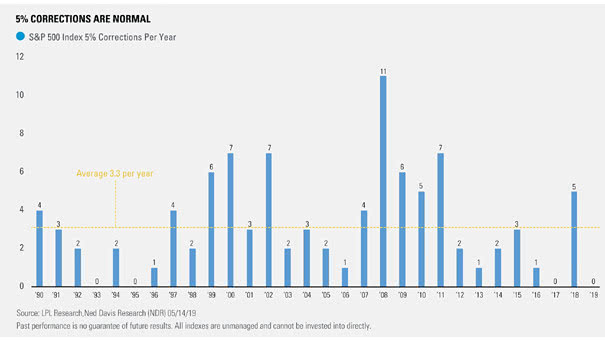
S&P 500 Index – Number of 5% Corrections Per Year Since 1990, there has been an average of 3.3 separate 5% declines for the S&P 500 per year. In a late business cycle, volatility increases. This is why, in 2019, we could see several drops of 5%. Image: LPL Research

“Real Fed Rates Are the Most Accurate Predictor of Future S&P 500 Volatility,” Says SocGen SocGen says it is the most accurate predictor of S&P 500’s volatility over the last 50 years. Should investors be nervous about rising real interest rates? Yes, higher real interest rates mean higher borrowing costs. Real Fed funds rate is…
Golden Cross Materializes in S&P 500 Price Action JPMorgan’s Philip Camporeale and David Kotok, CIO at Cumberland Advisors, discuss the late cycle euphoria. Rally in equities continues until it stops!