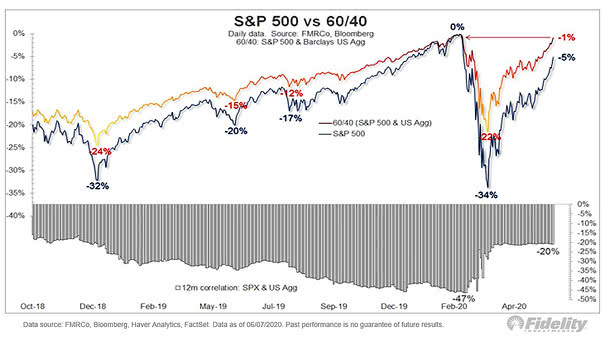
S&P 500 vs. 60/40 Portfolio
S&P 500 vs. 60/40 Portfolio Since 2020, the S&P 500 has delivered higher returns than the 60/40 portfolio but with greater volatility, while the 60/40 portfolio has provided more stability at the cost of lower overall gains. Image: Bloomberg