VIX (Volatility) and Implied Equity Risk Premium
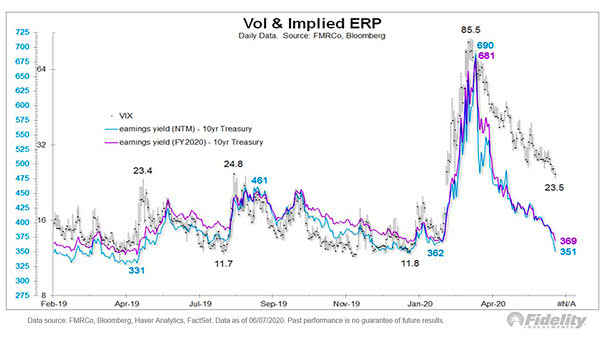
VIX (Volatility) and Implied Equity Risk Premium The risk of a correction is rising, as the implied equity risk premium is now below what the VIX would suggest. Image: Fidelity Investments
VIX (Volatility) and Implied Equity Risk Premium The risk of a correction is rising, as the implied equity risk premium is now below what the VIX would suggest. Image: Fidelity Investments
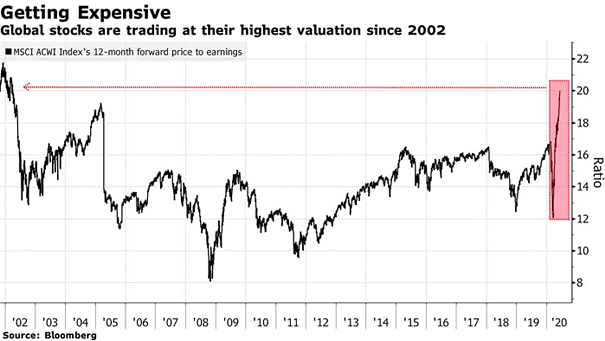
Valuation – MSCI ACWI Index’s 12-Month Forward Price to Earnings The risk of a correction is rising, as global stocks continue to rally and become more expensive. Image: Bloomberg

S&P 500 and Composite Momentum Indicator This chart suggests that the composite momentum indicator exposes investors to the risk of a short-term correction. Image: BCA Research
Time Taken for S&P 500 to Correct 10% from Peak The correction over the past six trading sessions is the fastest 10% decline in the S&P500 from a record high. Image: Deutsche Bank Global Research
S&P 500 Forward Return and Two Consecutive 3% Declines This table suggests that the current sell-off is a correction in a bull market. Image: Fundstrat Global Advisors, LLC
S&P 500 Index Statistics by Decade The S&P 500 has grown at an 11.2% annualized rate over the past 10 years, and has posted six corrections. Image: LPL Research
U.S. GDP and S&P 500 This interesting chart puts market corrections and U.S. GDP in perspective. Image: Oxford Economics, Macrobond
S&P 500 vs. U.S. Economic Surprises This chart shows the large divergence between the S&P 500 Total Return and the U.S. economic surprise. You may also like “S&P 500 at Risk of a 10% Correction.” Image: Nordea and Macrobond
Gold, U.S. Dollar, 10-Year Treasuries Bonds around 10% S&P 500 Declines The chart shows the average performances of gold, U.S. dollar, 10-year Treasury bonds, around S&P 500 corrections of -10% or more since 1976. Image: Wells Fargo Investment Institute
Over The Last 6 Months, The S&P 500 Lags Bonds, Gold And Global Stocks Last year, the sell-off of stocks was a correction from a bad equity risk premium and an overvalued stock market, as suggested by our forecasting models. Image: Bloomberg