Spread Between 10-ROC of S&P 500 and Treasury Bonds

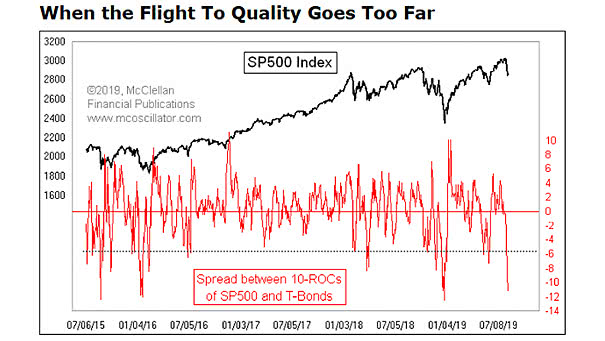
Spread Between 10-ROC of S&P 500 and Treasury Bonds This interesting chart shows a 10 trading day rate-of-change (ROC) for the SP500 and for near-month Treasury bond futures prices. A price low is forming now. Image: McClellan Financial Publications, Inc.
Expected Fed Funds Rate as of June 20, 2019

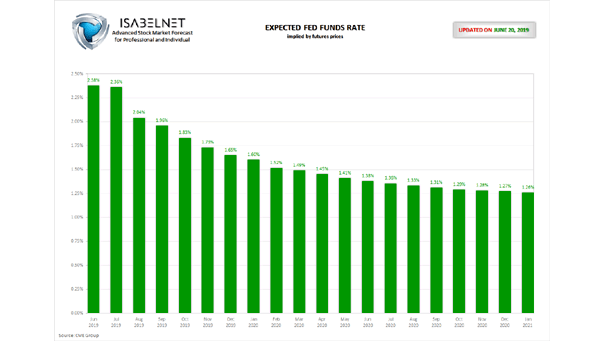
Expected Fed Funds Rate as of June 20, 2019 Fed funds futures for January 2021 imply an expected rate of only 1.26% (traders are pricing in more than four full cuts). You may also like “Markets Have Accurately Priced in Cuts before Easing Cycles Begin.”

The Market is Almost Wrong about What the Fed Will Do

The Market is Almost Wrong about What the Fed Will Do Actually, the Fed decides when to raise rates. But the market decides when to cut rates: “Markets have accurately priced in cuts before easing cycles begin.” Keep in mind that rate cut expectations are highly predictive six months in advance. You may also like “Fed Policy…

Expected Fed Funds Rate as of June 1, 2019

Expected Fed Funds Rate as of June 1, 2019 Traders are pricing in two full cuts in the fed funds target before the end of 2019. Fed funds futures for January 2020 imply an expected rate of only 1.85%.  Let’s hope the Fed gets the message from the market. You may also like “Markets Have…

Markets Have Accurately Priced in Cuts before Easing Cycles Begin

Markets Have Accurately Priced in Cuts before Easing Cycles Begin Orange lines mark days when markets priced in a rate cut. In recent history, it occurs between 33 and 281 business days before fed cut. The average is 120 business days. So, the Fed’s rate cut could take place in September 2019. You may also…