Market – Geographical Breakdown of MSCI World Index Constituents

Market – Geographical Breakdown of MSCI World Index Constituents The combined market capitalization of the Magnificent Seven would make it the second-largest country stock exchange globally. This would surpass the total value of many thriving economies. Image: BofA Global Research

U.S. Money Market Fund Assets

U.S. Money Market Fund Assets Following a Fed rate cut, U.S. money market funds typically experience outflows 12 months later as investors adjust their portfolios and manage risk in response to changing interest rates and market conditions. Image: Goldman Sachs Global Investment Research

Valuation – U.S. Equity Market Capitalization to GDP

Valuation – U.S. Equity Market Capitalization to GDP The U.S. equity market cap to GDP ratio is near an all-time high at approximately 187%, suggesting a significant overvaluation of the U.S. stock market. Image: Goldman Sachs Global Investment Research

Money Market Assets Under Management

Money Market Assets Under Management Following a Fed rate cut, money market funds typically experience outflows 12 months later as investors adapt portfolios and manage risk exposure in response to shifting interest rates and market conditions. Image: BofA Global Investment Strategy
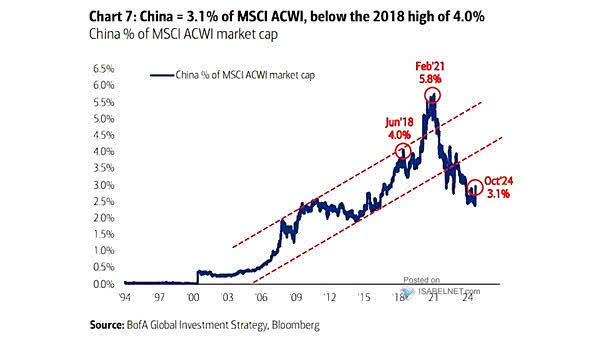
Global Equity Valuations

Global Equity Valuations The current market environment reflects a contrast between relatively cheap Emerging Markets (EM) and Developed Markets (DM) ex-U.S., and expensive U.S. stock valuations. Image: Topdown Charts

Money Market Fund Assets vs. Fed Funds Target Rate

Money Market Fund Assets vs. Fed Funds Target Rate Money market funds often experience outflows 12 months after the initial rate cut. This occurs as investors reallocate their investments and adjust their risk exposure in response to fluctuations in interest rates and market conditions. Image: BofA Global Fund Manager Survey

Money Market Flows

Money Market Fund Flows While the U.S. equity market has been steadily rising since its 2022 low, conservative investors maintain a strong inclination towards holding cash. Image: BofA Global Investment Strategy
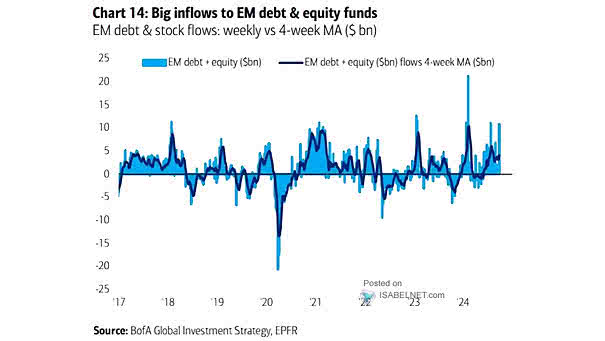
Secular Bull Market Analogs and S&P 500

Secular Bull Market Analogs and S&P 500 Since the Great Recession, U.S. stocks have behaved like a secular bull market, which is characterized by an extended period of growth and rising prices. Image: BofA Global Research

S&P 500 – Secular Bull and Bear Markets

S&P 500 – Secular Bull and Bear Markets The strong performance of the S&P 500 in 2023 and 2024 could be seen as a clear indication of a more sustained secular bull market, potentially extending until the late 2020s and early 2030s. Image: BofA Global Research Click the Image to Enlarge

U.S. Stocks – Magnificent Seven Market Value as a Percent of S&P 500 Market Value

U.S. Stocks – Magnificent Seven Market Value as a Percent of S&P 500 Market Value The concentration of the Magnificent Seven U.S. stocks has a significant impact on the performance of the S&P 500. While these stocks have performed well, the over-reliance on them poses potential risks for investors. Image: BofA Global Investment Strategy