S&P 500 Monthly Returns During an U.S. Election Year

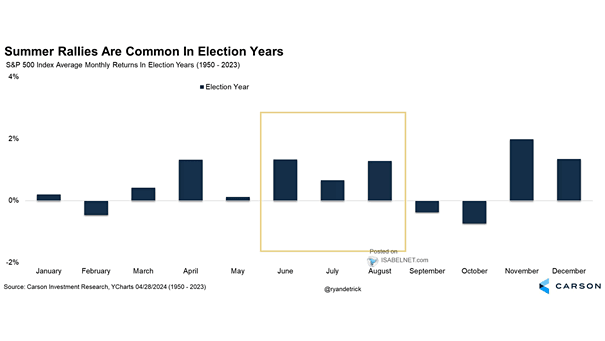
S&P 500 Monthly Returns During an U.S. Election Year The S&P 500 has historically performed well in August during presidential election years, contributing to an overall positive market sentiment and potentially extending the summer rally. Image: Carson Investment Research
Nasdaq Composite Weekly Chart with 40-Week and 200-Week MAs

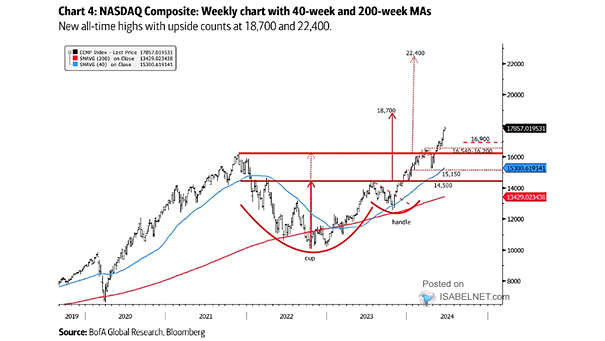
Nasdaq Composite Weekly Chart with 40-Week and 200-Week MAs The Nasdaq may potentially reach 18,700 and 22,400, given the possibility of a catch-up trade within a secular bull market presidential cycle. Image: BofA Global Research

S&P 500 3-Month Performance During an Election Year

S&P 500 3-Month Performance During an Election Year In Presidential election years, June to August stands out as the strongest 3-month period of the year. The S&P 500 has been up 75% of the time, with an average return of 7.3% since 1928. Image: Carson Investment Research

Average S&P 500 Returns by Election Cycle Year

Average S&P 500 Returns by Election Cycle Year The dynamics and uncertainties of the electoral process often impact market performance in presidential election years, leading to a historical trend of weaker S&P 500 returns. Image: Goldman Sachs Global Investment Research

Distribution of S&P 500 12-Month Total Returns

Distribution of S&P 500 12-Month Total Returns Goldman Sachs, in its base case scenario, expects the S&P 500 index to generate a total return of 6% in 2024, which is slightly below the average return typically observed during presidential election years.

VIX Curve and U.S. Election

VIX Curve and U.S. Election Investors expect more volatility ahead of the U.S. presidential election. Image: Financial Times

U.S. Elections – Pre-election Equity Performance vs. Average

U.S. Elections – Pre-election Equity Performance vs. Average Chart showing how the U.S. stock market has performed before and after presidential elections (“Closely contested” is defined as the margin of popular vote being below average). Image: Morgan Stanley Research

Volatility and U.S. Elections

Volatility and U.S. Elections This chart shows how U.S. presidential elections affect volatility when the same party remains in office or not. Image: Goldman Sachs Global Investment Research