U.S. Equity Indices Futures
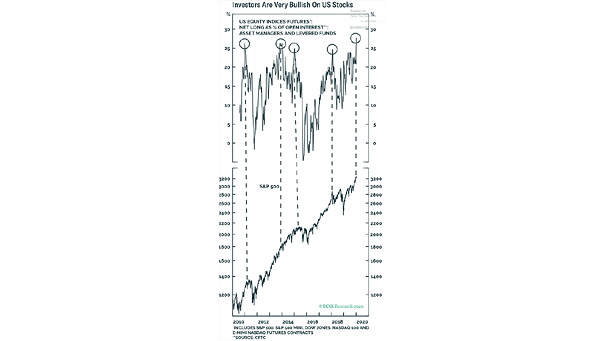
U.S. Equity Indices Futures The U.S. stock market is on fire. Investors have grown extremely bullish. Image: BCA Research
U.S. Equity Indices Futures The U.S. stock market is on fire. Investors have grown extremely bullish. Image: BCA Research
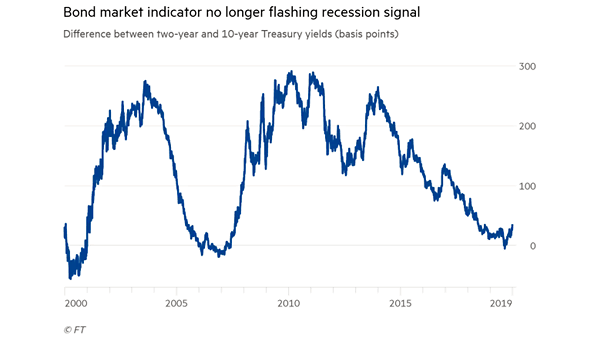
10Y-2Y Yield Curve and U.S. Recession The U.S. yield curve is steepening and suggests optimism for 2020, as investors become more confident in the U.S. economy. Image: Financial Times

Federal Reserve’s Balance Sheet and “Not QE” Welcome to “Not-QE”. The Fed’s balance sheet is expanding at fastest rate since the Great Financial Crisis. Image: US Global Investors
Debt – U.S. Shale’s Maturity Wall and Interest Should investors be concerned about the shale’s wall of maturity? There is no doubt about it. Image: Quill Intelligence, LLC
Holdings of U.S. Treasuries as Percent of Treasury Debt Outstanding U.S. domestic investors are buying a lot of U.S. Treasuries, while foreign demand is weakening. Image: Deutsche Bank Global Research
Private Debt Assets Under Management Private debt assets under management have tripled over the past decade to $812 billion. Investors are looking to increase yield in a world of low interest rates. Image: Goldman Sachs Global Investment Research
Debt Securities Issued by S&P 500 Companies Should investors be concerned about the corporate debt maturity wall? This chart shows the long term S&P 500 debt maturity schedule. Image: J.P. Morgan US Equity Strategy & Global Quantitative Research
U.S. Demographics – Portfolio Allocation to Equities Chart suggesting that the average U.S. investor will move from holding 59% in equities to 56% by 2031, due to aging. Image: Arbor Research & Trading LLC
Global Equity Flows A lot of investors are chasing returns, driving stocks higher. Image: Deutsche Bank Asset Allocation
ISM Manufacturing Index and Credit Returns Across Economic Cycles Since 2004 If investors get the ISM Manufacturing right, they do well. Image: J.P. Morgan Asset Management
Inflows to U.S. Equity ETFs Investors are back into equities. Last month, more than $38 billion flowed into equity-focused ETFs. Image: Bloomberg