The Rise of ETFs May Distort the Stock Market
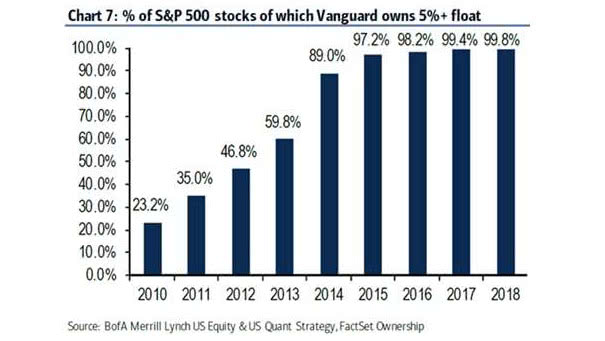
The Rise of ETFs May Distort the Stock Market Vanguard holds more than a 5% stake in 99.8% S&P 500 stocks. Image: BofA Merrill Lynch
The Rise of ETFs May Distort the Stock Market Vanguard holds more than a 5% stake in 99.8% S&P 500 stocks. Image: BofA Merrill Lynch
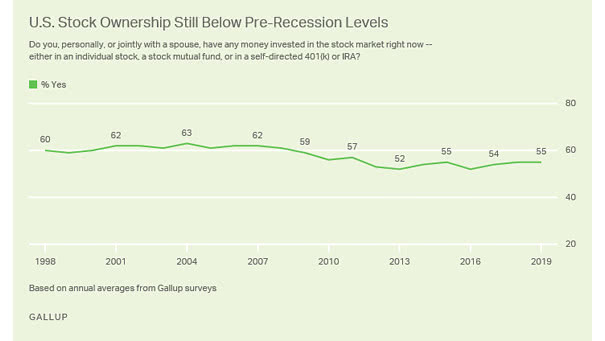
U.S. Stock Ownership Still Below Pre-Recession Levels Despite the strong performance of stocks since 2009, U.S. stock ownership remains lower than it was before the Great Recession or the Dotcom bubble. Image: Gallup

Concentration of Stock Ownership by Wealth Bracket As the chart shows, the top 20% wealthiest American households own over 93% of stocks. You may also like “How the Composition of Wealth Changes from the Middle Class to The Ultra Rich?” and “U.S. Net Worth by Wealth Bracket.” Image: Visual Capitalist
US Long-Term Mortgage Rates Decline: 30-Year Average 4.10% & 15-Year Average 3.57% Why US long-term mortgage rates decline? Mortgage costs are influenced by the 10-year Treasury yield which was lower this week, because the trade war between the United States and China pushes investors moving money from stocks to bonds. Bond yields fall as prices rise.…
S&P 500 Largest Pullbacks in the First Five Months of Each Year Over the last 50 years, the S&P 500 has performed the first five months of the year without a decline of at least a 2.5% pullback only once in 1995. Is a pullback for U.S. stocks approaching? Image: J.P. Morgan See S&P 500 Intra-Year…
Tariffs Are a Hidden Tax on American Consumers and Companies Tariff man is back! Keep in mind that trade war costs to consumers and companies. Tariffs are a hidden tax on American consumers and US firms. Trump’s trade war hurts the U.S. economy and stocks.
Warren Buffett Talks Investment Strategy and Mastering the Market “Well, I look at a lot of figures just in connection with our businesses. I like to get numbers. So I’m getting reports in weekly in some businesses, but that doesn’t tell me what the economy’s going to six months from now or three months from…
What An Average Stock Market Correction Looks Like? Stock market corrections are normal. On average, there is one correction per year, during 71.6 days and a decline in stocks of about 15.6% Image: Visual Capitalist
Ken Fisher on What to Expect in 2019 | Fisher Investments Ken Fisher, founder of Fisher Investments, tells us why he believes 2019 will be a strong year for stocks in a fine global economy. https://www.youtube.com/watch?v=kYdrFfpMuVw
https://www.isabelnet.com/wp-content/uploads/2019/03/stock-market-equity-risk-premium.mp4 This fabulous model shows if the US stock market return for the next 10 years is more or less attractive than the 10-Year Treasury Note The US stock market equity risk premium is the US stock market excess return for the next 10 years over the US 10-year Treasury Note. This is the premium…