Fear Of Recessions? S&P 500 Bull and Bear Markets since 1946
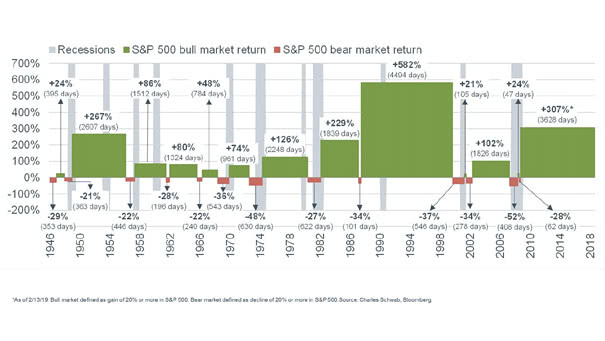
Fear Of Recessions? S&P 500 Bull and Bear Markets since 1946 A long-term investor should put downturns in perspective. Image: Charles Schwab
Fear Of Recessions? S&P 500 Bull and Bear Markets since 1946 A long-term investor should put downturns in perspective. Image: Charles Schwab
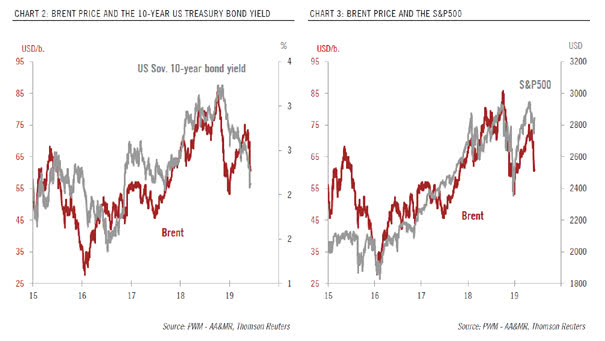
Brent Price vs. 10-Year Treasury Bond Yield vs. S&P 500 This chart shows that oil prices are a good indicator of global economic growth and investors are concerned about a global economic slowdown. Image: Pictet Wealth Management

Could European Stocks Outperform U.S. Stocks? This chart shows U.S. vs. European stocks at 70-year highs. Keep in mind that investors think that the euro area economy is less resilient than the U.S. economy in the event of a shock. Currently, the euro area economy is more impacted by the global slowdown than the U.S.…
New York Fed Probability of Recession in Next 12 Months since 1990 When an inverted yield curve occurs, short-term interest rates exceed long-term rates. It suggests that the long-term economic outlookis poor and that the yields offered by long-term fixed income securities will continue to decline. Since 1962, no recession has occurred without an inverted…
$11 Trillion Bonds Globally Trade At Negative Interest Rates The total amount of negative interest rates climbed to USD 11 trillion. Investors are paying governments for the privilege of holding their bonds and are losing so much money in real terms. Image: Deutsche Bank Global Research
Estimated Number of Hedge Funds Launched or Closed since 2008 Can hedge funds deliver higher returns than passive investing? Not really. But many investors still think they can achieve higher returns with active trading than with passive investing. The chart below shows that it is really hard to outperform the market. As Warren Buffett said,…
Mutual Fund Flows – Asset Allocation Funds since 2000 Dynamic/flexible and balanced funds saw significant outflows since 2018. It is obvious that many investors don’t have a long-term view. Image: Topdown Charts
Decomposing the U.S. 10-Year minus 3-Month Treasury Yield Spread since 2013 This great chart shows that the “Global Economic Data” variable has a significant impact on the U.S. 10-year minus 3-month Treasury yield spread since 2018. An R² of 0.902 means that more than 90 percent of the variance in the U.S. 10-year minus 3-month Treasury yield spread…
The U.S. Corporate Bond Debt Rated ‘BBB’ Exceeds $3 trillion The U.S. corporate bond debt rated ‘BBB’ exceeds $3 trillion. That’s 53% of investment-grade bonds in the United States. Any drop in the credit ratings could amplify the next recession: many investment grade investors own BBB-rated bonds, but are not allowed to hold junk-rated bonds.…
US Yield Curve Inversions since 1966 Currently, investors are concerned about yield curve inversions, because they have been a indicator of a coming recession. But not all inversions are the same. If the yield curve inversion is due to 10-year falling, then it is a “risk-off” trade, and not an economic cycle turn. This great chart…
“You Need to Divorce your Mind from the Crowd…” –Warren Buffett Quote of the day: “You need to divorce your mind from the crowd. The herd mentality causes all these IQ’s to become paralyzed. I don’t think investors are now acting more intelligently, despite the intelligence. Smart doesn’t always equal rational. To be a successful…